Private Equity Waterfall Structures
The successes of the business are frequently defined by the results of the business namely the headline returns, the glorified exits, the portfolio companies that were brought about under the ownership of the fund. Less emphasized, especially to junior professionals in the industry, is the machinery that generates such results: the structuring of deals at the entry point, the overlaying of capital over various instruments, and the ultimate sharing-out of economics of a transaction between investors, management and the fund itself. These mechanics are not some incidental details. They are the design of the private equity and knowing them is what can transform those who are competent analysts into true deal professionals.
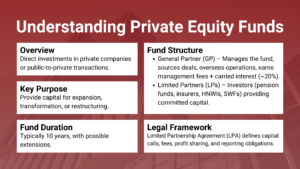
This paper discusses two of the most significant and most intertwined notions in the field of finance of private equity deal structuring and waterfall distributions. Deal structuring is the financing of a transaction, the combination of equity, debt and hybrid instruments that are used to finance an acquisition of a business and the risk and returns profile of each party involved. The waterfall is the contractual process through which the investment proceeds are allocated upon a sale, recapitalisation or listing of a portfolio company. These two concepts collectively define the amount, who makes the money, and in which order – hence they are the centre of any serious course on the structuring of a typical deal in the field of private equity and venture capital training.
The difficulty with junior and mid level professionals is that both subjects are discussed in general terms and lacks enough reference to how they should be practiced. A deal structure is not simply a diagram of debt and equity tranches – it is a complex of choices that have actual implications on how the business is run, what happens in times of stress and what the end result of the business would look like. A waterfall is not merely a formula, it is a negotiated pact between investors and fund managers that shows the congruence of incentives that lie at the core of the private equity model. This article unravels them both using practical examples, process frameworks as well as what experienced practitioners have learnt in the process.
The Architecture of a Private Equity Deal Structure
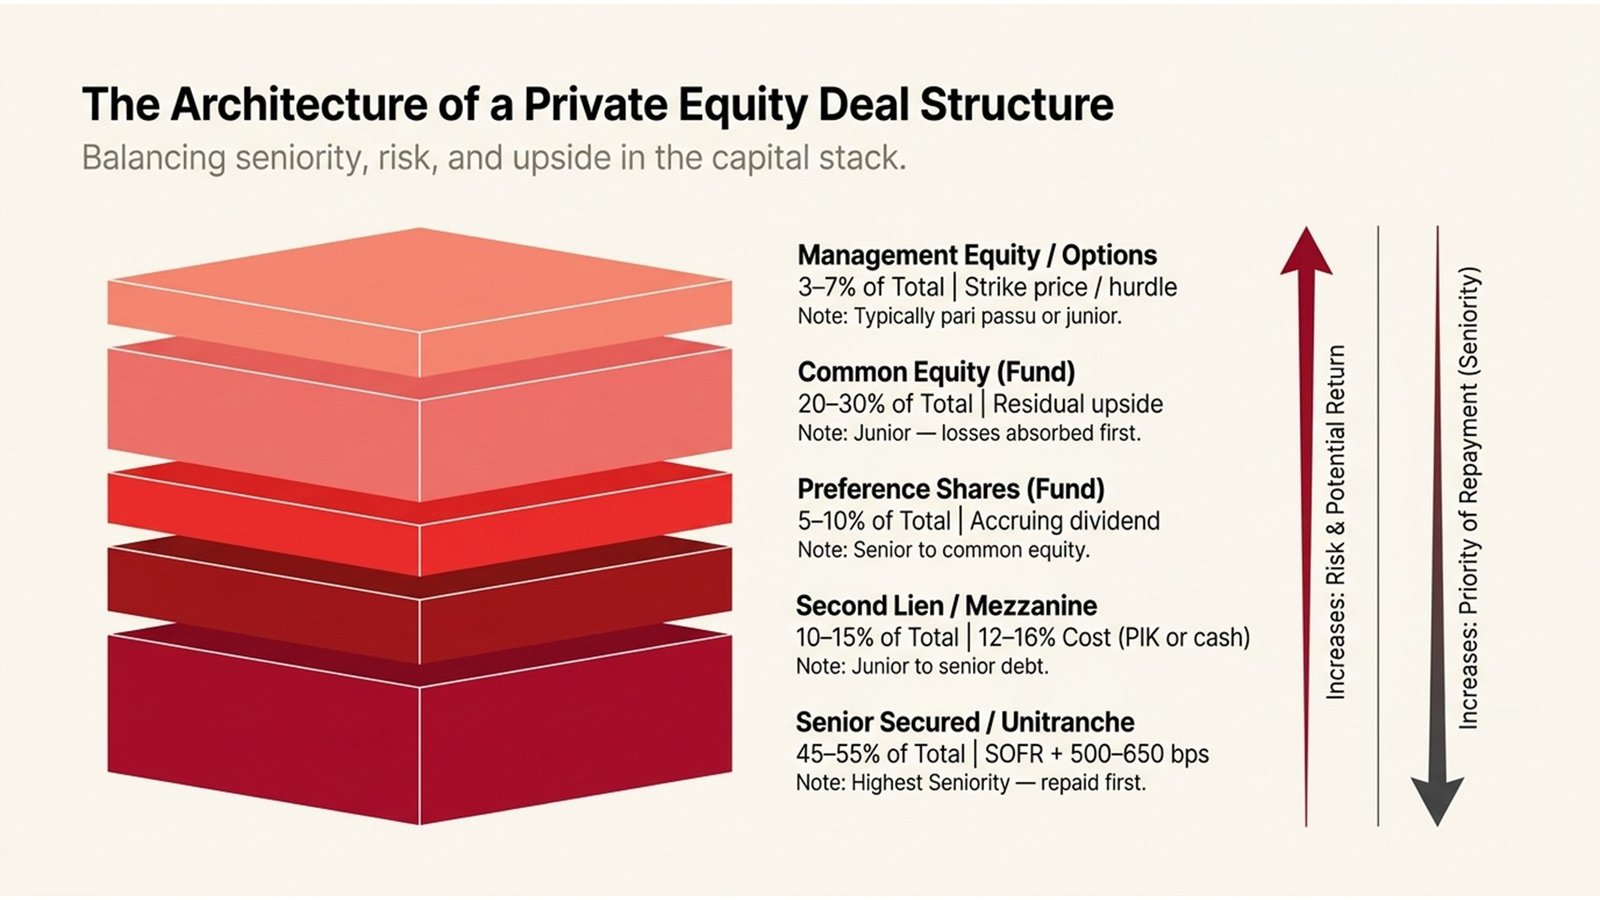
A basic form of a private equity acquisition would be a mix of equity capital supplied by the fund and debt capital borrowed based on the assets and cash flow of the target business. This is the debt that makes leveraged buyouts their name, when a business is successful, the returns are magnified as the equity investor gets the entire upside, but had contributed only a small fraction of the purchase price. A company purchased at a price of 500M and the debt amounted to 350M and the equity amounted to 150M is sold at a price of 750M, the percentage increase in value of the equity is much higher than the return on equity as indicated by the headline price increase. Understanding leveraged buyouts structure and mechanics means understanding precisely this relationship between debt quantum, equity contribution, and the return multiple it produces.
Practically, the debt part of a deal structure is further stratified with various instruments, which have varying seniority, cost, and covenant profile. The senior secured debt, which is usually supplied by banks or more and more often by direct lenders, is at the very top of the capital structure, and is the first to be paid in a situation featuring an exit or a liquidation. At the bottom is unitranche debt (a mixed single-tranche instrument frequently found in middle market transactions) or second lien debt, or mezzanine financing, with increasingly higher interest rates in return for lower ranking of repayment. The equity layer is at the bottom implying that it bears losses, but also gains excessive headroom in the event that the business is sold at a high value on the sale side.
Even equity in a private equity is not monolithic. In the majority of transactions, there is a difference between ordinary shares and preference shares – or between the common equity and the preferred equity in US terms. The management teams and co-investors tend to have a different equity class than the primary fund, whose economic rights vary. Warrants, ratchets, and hurdles are popular to adjust the management incentives with the fund returns by enhancing equity share of management in case of surpassing performance levels of the business. This internal equity structure is a subtle field which earns little or no focus in any introductory finance course, but which is a focus of any course on advanced deal structuring in the field of private equity.
Table 1: Typical Capital Structure in a Mid-Market Leveraged Buyout
| Instrument | Typical % of Total | Cost (Indicative) | Seniority |
| Senior Secured / Unitranche | 45–55% | SOFR + 500–650 bps | Highest — repaid first |
| Second Lien / Mezzanine | 10–15% | 12–16% (PIK or cash) | Junior to senior |
| Preference Shares (Fund) | 5–10% | Accruing dividend | Senior to common equity |
| Common Equity (Fund) | 20–30% | Residual upside | Junior — losses absorbed first |
| Management Equity / Options | 3–7% | Strike price / hurdle | Typically pari passu or junior |
How Waterfall Distributions Work in Practice
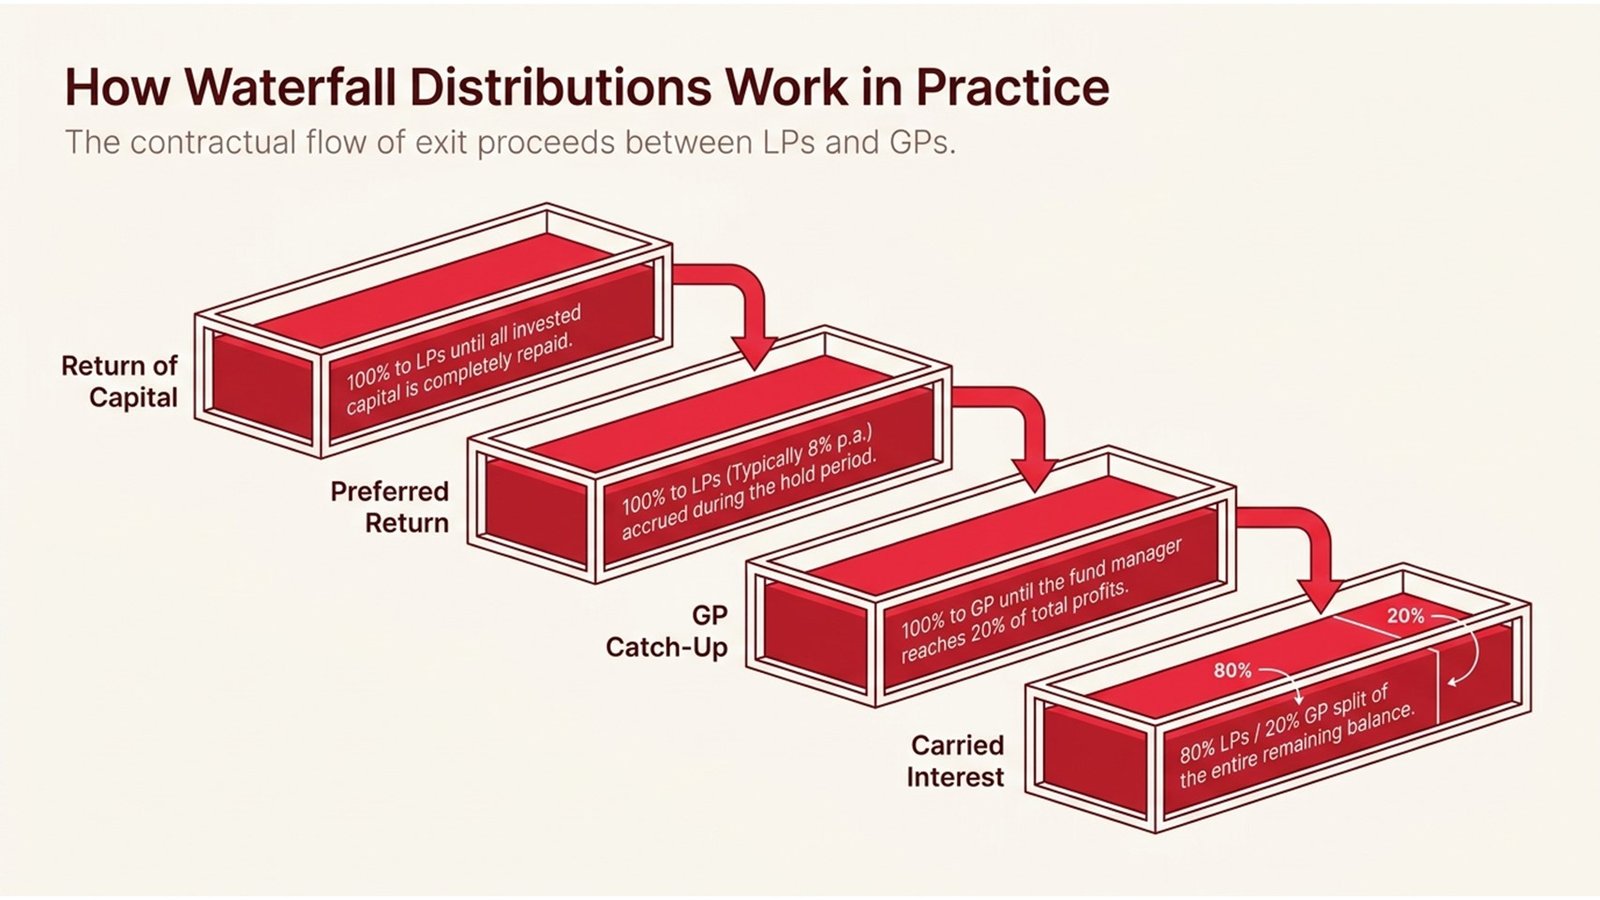
The waterfall is the process through which exit proceeds of a trade sale, secondary buyout or IPO are allocated to the different parties that invested in the fund. The expression “waterfall” is very relevant: the money has to go to all levels, filling the levels and overflowing to the next one. These levels and order are stipulated in the fund Limited Partnership Agreement (LPA) and are used to set the economics of the fund manager carried interest, or the performance fee, which is generally the main revenue of the investment professionals of the private equity firm.
A typical waterfall structure starts when limited partners (LPs)- institutional investors who put money into the fund- begin to receive the money invested in the fund back. The preferred return, also referred to as the hurdle rate is the next tier after capital has been returned in full. It is a minimum of the annual returns, which must be paid to the LPs and in this case, it is generally 8 percent before the general partner (GP) can get a single cent of carried interest. When the exits of the fund are producing returns in excess of the hurdle rate, then the waterfall passes over to the catch-up provision and the GP is entitled to a disproportionate share of proceeds up to the point that they have obtained the agreed percentage of total profits (typically 20 percent). In addition to the catch-up, the balance of the remaining proceeds is divided between the 80/20 basis between the LPs and the GP.
It is notable that the waterfall structures differ significantly among funds as well as geographies. European-style waterfalls are based on the calculation of the hurdle and carry in terms of whole-fund basis – i.e. the GP is not subjected to carry until the whole fund has already paid out capital and the hurdle, and not on individual deals. In comparison, American-style waterfalls compute carry on a deal-by-deal basis, thus can have the effect of giving carry to GPs on successful deals made early to a fund despite subsequent poor performance of investments in the same fund. These differences are important in both private equity and venture capital training, as they imply a considerable amount in the returns to the LPs, as well as the manner in which fund managers order their exits.
Table 2: European vs. American Waterfall — Key Differences
| Feature | European (Whole-Fund) Waterfall | American (Deal-by-Deal) Waterfall |
| Carry calculation basis | Entire fund performance | Individual deal performance |
| When GP receives carry | Following complete repayment of funds + hurdle. | Once a deal has passed its hurdle. |
| LP protection | Higher -losses before carry. | Lower — carry paid prior to all before any losses known. |
| Clawback risk | Lower | Higher — GP can be subject to carry back. |
| Common in | European PE funds | US PE and VC funds |
Five Steps to Analysing a Deal Structure and Waterfall
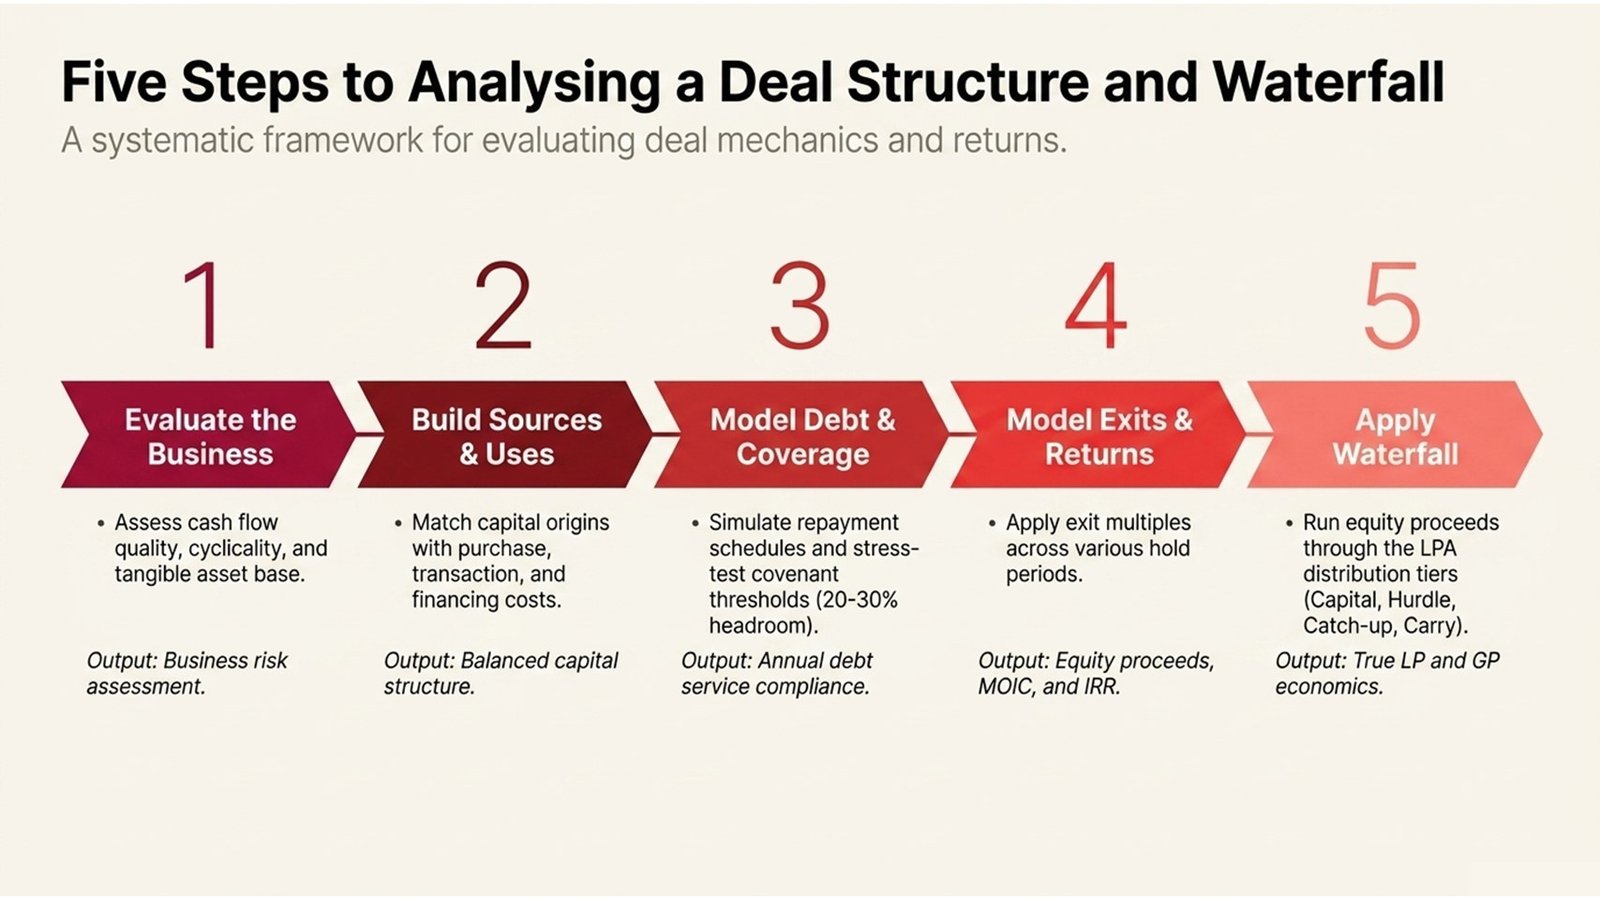
Developing a deal structuring and waterfall analysis fluency needs to be systematic. The five steps below will help junior and mid-level professionals to take them through the analysis process in a manner that is similar to how the more experienced practitioners analyze transactions. Here are steps that can be used during a live deal, when reading a case study in a course on deal structuring in a private equity firm or during an interview where you are tested on deal mechanics.
The first step is to know the business prior to reaching the capital structure. The correct degree of leverage of any acquisition is all about the nature of the underlying business: how stable and predictable its cash flows are, how cyclical its industry, how much working capital it needs, and how tangible its asset base is. The higher the contracted and recurring nature of revenues in a business, the more debt can generally be supported by that business compared to project-based and discretionary revenues. The capital structure is always used by the analysts who make errors in estimating debt size and estimating debt services coverage when they make a decision prior to knowing the business. The second step is to construct the sources and uses table the document on which any deal structure is based. Sources indicate the origin of the money: senior debt, mezzanine, fund equity, co-investor equity, rollover equity by management. Uses indicate the direction of the money: purchase price, transaction price, financing price, and cash remaining on the balance sheet. The use must match the sources, and an unbalance will indicate an error in the structure.
The third step is to simulate the debt repayment and coverage ratios over the investment period. Each year of the estimated hold period you must have information about the amount of debt outstanding and the interest on the debt, and the amount of free cash flow to service the debt. The most important here will be the interest coverage ratio (EBITDA/interest expense) and the net leverage ratio (net debt/EBITDA). Both will have specified covenant thresholds by lenders, and the model will indicate clearly whether the business remains in those thresholds even in a stress situation – precisely the sort of analysis that is discussed in a more in-depth manner in programmes on the leveraged buyouts structure and mechanics.
The fourth step is to model the exit and returns. With a variety of exit multiples and exit years, compute the enterprise value of the business at the exit, less net debt outstanding at exit and calculate the equity proceeds available to be distributed. This is then converted into the equity return to the fund in multiples of invested capital (MOIC) and an internal rate of return (IRR) which is a standard measure of PE performance. The fifth step is to use the waterfall. Add the proceeds of total equity and go through the LPA levels: return of capital, preferred return, GP catch-up, and carried interest. This final step shows the true economics to LPs and the GP both, a calculation not commonly included in simplified deal analysis but one that is imperative to determine the real congruity of incentives in any given private equity deal.
Table 3: Deal Analysis Process Flow
| Step | Activity | Key Output |
| 1 | Evaluate the business – quality of cash flows, cyclic, asset base. | Memo on business risk assessment. |
| 2 | Build sources and uses table | Equal equity capital structure. |
| 3 | Depicted debt table and coverage ratios. | Debt service and compliance with covenants on an annual basis. |
| 4 | Model exit situations (range of multiples and hold periods) | MOIC and IRR in various situations. |
| 5 | Add waterfall to equity proceeds. | LP and GP economics using scenarios. |
Real-World Cases and Lessons from the Field
The leveraged acquisition of Freescale Semiconductor in 2006 by a group of investors led by Blackstone, Carlyle, Permira, and TPG can still be regarded as one of the most informative case studies in the deal structuring. It was the greatest technology LBO in history at the time and the purchase price was about 17.6 billion financed by a large amount of debt. The transaction was done during the height of the pre-crisis credit cycle, at the time when leverage multiples were unprecedented and covenant-lite were prevalent. At the time of the 2008 financial crisis, Freescale revenues plummeted because the demand in the semiconductor fell and the considerable debt burden of the company left Freescale with very little financial flexibility. In 2009, Freescale finally declared bankruptcy, reorganized its capital stack and finally went public on the NYSE in 2011. This deal teaches us that leverage can be destructive, but it is the underlying cash flow cyclicality of the business that must be fairly evaluated prior to deciding on debt capacity. The technology hardware firms which are sensitive to the volatility of the end market are not good candidates to the type of leverage that is effective in defensive and stable-cash-flow firms.
The 2013 purchase of Dell by Michael Dell and Silver Lake Partners is a better example since it provides a lesson. The take-off of 24.9 billion was designed as a combination of committed bank debt, bridge loan and large amount of equity donation by the Silver Lake and Michael Dell himself – rollover equity that was one of the largest management co-investments in LBO history. The alignment through that rollover was the core of the investment thesis of the deal: Michael Dell will remain the leader and have a huge personal financial interest, which will make sure that the management incentives are highly correlated with the objectives of the fund in terms of returns. Silver Lake made high returns when Dell later bought EMC in 2016 and re-listing in 2018. The transaction is frequently mentioned in the private equity and venture capital training as an example of how careful equity structuring, and especially the management equity aspect, can be of significant importance in deal results as the amount of debt itself.
The third lesson is based on the mid-market, where the waterfall fights between GPs and LPs have surfaced as a point of friction at times. In a number of reported instances, European fund managers who moved to deal-by-deal calculation of carry in mid-fund amendments were challenged by the LPs and in some instances, challenged in court. The greater point here is that the waterfall provisions of the LPA are not boilerplate- they must be negotiated with great care during the creation of a fund, and ought to be stress-tested against the possibility of a hypothetical gain or loss before being accepted. To practitioners joining the industry, learning how to read and model LPA waterfalls is as essential as being able to learn the deal structure itself, since the two cannot be separated at the end of the day in deciding the economics of any kind of investment.
Table 4: Waterfall Distribution Process Flow — Illustrative Exit
| Tier | Description | Amount Distributed (Illustrative) |
| 1 — Return of Capital | LPs are paid back all invested capital. | $200M (full fund equity invested) |
| 2 — Preferred Return (8% p.a.) | LPs get 8% yearly capital returns during hold period. | $48M (3-year hold) |
| 3 — GP Catch-Up (100%) | GP is paid 100% of proceeds up to 20% of total profits. | $62M (to reach 20% of profits) |
| 4 — Carried Interest (80/20 split) | Remaining Balance is divided 80% LP / 20% GP. | $190M LP / $47.5M GP |
| Total Proceeds | 100% of gross equity exit proceeds. | $547.5M |
Challenges, Pitfalls, and What Practitioners Have Learned
Over-levering a business using peak earnings as opposed to through-the-cycle cash flows is one of the most common structuring errors of less experienced deal teams. Trailing EBITDA on an acquisition of a business towards the end of an earnings cycle can be of great importance to the company in relation to its actual cash generation capacity. The lenders and sponsors that base their debt size to peak EBITDA without haircutting of normalisation, frequently realise that the business cannot service its debt in a less aggressive earnings setting. This is made more difficult in cases where acquisition multiples are large, as they have been in most of the 2015-2023 in most markets high entry price and high leverage is a particularly dangerous mix in case the business faces any operational headwinds after the close.
The second challenge is the management equity makeup. Hurdle-based and ratchets incentive schemes are aimed at aligning the interests of the management to the returns on funds, yet the schemes that are poorly chosen can do the opposite. When management has to jump the hurdle to earn meaningful equity at what seems to be an impossible level given the entry price of the deal and the market environment, it may demotivate instead of incentivise the management. On the other hand, excessively generous schemes at small levels of returns may also lead to dilution of fund economics before an appropriate level of return is given to the LPs. To achieve this balance, it is important to model the waterfall using a variety of return scenarios – which is exactly the type of analysis practitioners are taught in leveraged buyout structure and mechanics programmes.
The lesson of a third experienced practitioner is what is meant by headroom of covenant. One cannot just construct a model that demonstrates compliance with covenant case under the base case. The model must exhibit sufficient headroom – normally 20-30 percent above covenant levels- in a realistic downside case. Breaches of covenant lead to costly waiver procedures, may lead to unstable lender relations, and in extreme instances may give lenders the mandate to impose restructuring on conditions that do not favour holders of equity. Seasoned deal professionals incorporate covenant analysis into the deal structure early on, and they can afford a bit less debt and thus a bit lower IRR in the base case to obtain the structural strength that headroom affords.
Conclusion: Actionable Insights for Aspiring Deal Professionals
The private equity deal structuring and waterfall analysis are the fields where experience and deeper insight are valued over superficial knowledge. The practitioners who become the quickest in this industry are the practitioners who become truly fluent in the mechanics – who can read a capital structure diagram and instinctively grasp what it means to risk and what it means to return, as well as what it means to covenant headroom; who can build a waterfall in a vacuum and the economics of that waterfall, and how to relate that technical expertise to the strategic and operational reality of the business they are analy
The initial action plan that junior professionals can take is to create a model. Consider a real LBO transaction – Freescale or Dell as addressed in this article or one of the numerous case studies of such deals that can be found in the academic and professional literature – and recreate the deal structure in Excel. Construct the sources and uses table, the debt schedule, the returns model and the waterfall. A single attempt at this with a real transaction instructs better than reading all about it numerous times. The second one is to read LPAs. LPA is not a light reading, however the most significant section of the LPA is the waterfall provisions, which one needs to learn in order to have knowledge of the economics of private equity. The redacted LPA examples will be shared with finance professionals interested in learning the industry and some of the training courses provided by private equity and venture capital training programs feature LPA analysis as a course.
Third, learn to consider capital structures by considering both sides in the transaction at the same time. Different risk tolerance, expectation of returns and incentive structure exist between the senior lender, the mezzanine provider, the fund, the co-investors, and the management team. A deal structure which suits all is one which has been thought through in each of those points of view – and it is those who can think concurrently in all of them who create the strongest deal teams and the longest history of investment track records.
Last but not least, in need of formalising their knowledge, look at programmes that incorporate technical deal modelling along with legal and commercial environment of PE deals. An effective course on the structuring of a private equity deal must bring you not only to the mechanics of leveraged buyouts structure and mechanics but also to the waterfall economics of the distribution of funds – not as discrete subjects but as the system they are in the real world. This amalgamation or combination of deal structure, business performance and investor economics is what private equity is all about. The distinction between those who follow instructions and those who bring an authentic analysis to any transaction they handle is how they understand it.